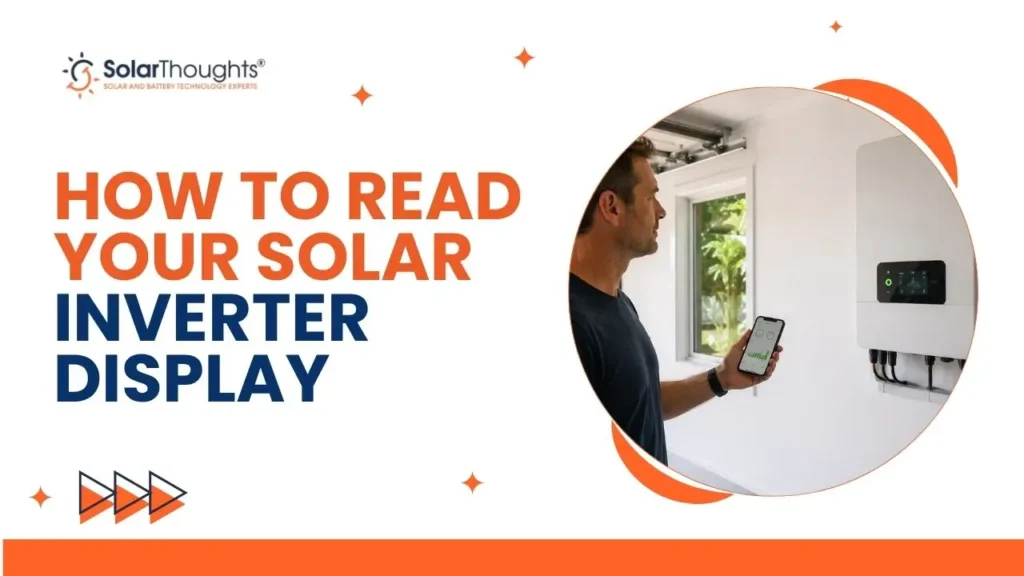
Your solar inverter has been quietly working on the garage wall for years, cycling through numbers on its little screen. You glance at it occasionally but you’re not entirely sure what you’re looking at. Is 3.2 a good number? Should it be higher? What does that blinking symbol mean?
Table of Contents
ToggleMost Brisbane homeowners with solar have never walked through their inverter display. This guide changes that. In a few minutes you will know exactly what every key reading means, what healthy output looks like for your system size in Brisbane conditions, and when something on that screen should prompt you to call your installer.
The Two Most Important Numbers: kW vs kWh
Quick Answer: kW (kilowatts) tells you how much power your solar panels are producing right now, at this exact moment. kWh (kilowatt-hours) tells you how much total energy has been generated today since sunrise. These are completely different measurements, and confusing them is the most common misread on any inverter display.
Think of it with a simple analogy. kW is like your car’s speedometer: it shows how fast you are going right now. kWh is like the odometer: it shows how far you have travelled in total today.
Your kW reading changes constantly. It rises as the sun climbs in the morning, peaks around noon (roughly 11:30am to 12:30pm in Brisbane depending on the time of year), and drops in the afternoon. It falls to zero at night, which is completely normal. Your kWh reading, labelled E-Day, Today’s Yield, or Daily Energy depending on your brand, climbs steadily from zero each morning and reaches its final value at sunset.
The kWh figure tells you whether your system had a good day. The kW figure tells you whether it is working well right now.
[IMAGE 1: Diagram showing kW as a real-time speedometer vs kWh as a daily odometer on an inverter display. ALT: solar inverter display kW vs kWh explained Brisbane]
What Every Reading on the Display Actually Means
Most residential inverters installed in Brisbane, including GoodWe, Sungrow, and Fronius models, rotate through a core set of readings. Here is what each one tells you:
| Reading | Unit | What It Means | Normal Range (Brisbane) |
| Current Power Output | W or kW | Power your panels are generating right now | 0 at night, peaks at midday |
| Daily Energy (E-Day) | kWh | Total energy generated since sunrise today | Resets to zero each morning |
| Total Energy | kWh or MWh | Cumulative generation since installation | Grows steadily over time |
| DC Voltage | V | Voltage from your solar panels to inverter | Varies by system size and string config |
| AC Voltage | V | Grid voltage at your property | 216V to 253V per AS 4777.2:2020 |
| AC Frequency | Hz | Grid frequency | Close to 50.00 Hz |
| Inverter Temperature | Degrees C | Internal operating temperature | Under 75 degrees C is normal |
AC voltage and frequency limits are set under Australian Standard AS 4777.2:2020, which governs inverter grid connection requirements in Australia.
The AC voltage reading matters specifically for Brisbane. The Energex network supplying South East Queensland can occasionally deliver voltage above 250V during periods of high solar generation. Under AS 4777.2:2020, inverters must reduce output or disconnect when voltage exceeds the permitted range. If your inverter is consistently cutting out during peak midday hours on clear days, high AC voltage from the grid may be the cause.
What Good Output Looks Like for a Brisbane System
Brisbane averages 5.2 peak sun hours per day according to Clean Energy Regulator zone data. Here is what healthy midday output looks like for the most common residential system sizes on a clear day between 10am and 2pm:
| System Size | Healthy Midday Output (Clear Day) | Typical Daily kWh (Summer) | Typical Daily kWh (Winter) |
| 6.6kW | 4.0 to 5.5kW | 26 to 30 kWh | 16 to 20 kWh |
| 8.8kW | 5.5 to 7.5kW | 34 to 40 kWh | 22 to 27 kWh |
| 10kW | 6.5 to 8.5kW | 40 to 47 kWh | 26 to 32 kWh |
| 13.2kW | 8.5 to 11kW | 52 to 62 kWh | 34 to 42 kWh |
Indicative ranges based on Brisbane’s 5.2 peak sun hours, north-facing orientation, standard conditions. Shading, pitch, and orientation affect actual output. Source: Clean Energy Regulator solar zone data.
The practical rule of thumb: at peak midday on a clear Brisbane day, a well-performing system should generate roughly 75 to 85% of its rated capacity in kilowatts. A 6.6kW system showing 5kW at midday is performing well. The same system consistently showing 2.5kW at midday on a clear day has a problem worth investigating.
[IMAGE 2: Infographic showing expected daily kWh output ranges for 6.6kW and 10kW Brisbane systems in summer vs winter. ALT: solar inverter expected daily output Brisbane 6.6kW system summer winter]
Common Display Symbols and What They Mean
Most inverters use icons alongside their numerical readings to communicate system status at a glance. These are the symbols you will encounter on virtually every residential inverter installed in Brisbane:
• Sun icon: Your panels are actively generating. If absent during clear daylight hours, something needs attention.
• Grid icon: The inverter is connected to the Energex network and exporting surplus power normally.
• House icon: Power is flowing to your home appliances from the solar system.
• Battery icon: Visible on hybrid systems. Shows the state of charge.
• WiFi icon: The inverter is connected to your home network and transmitting data to the monitoring app.
• Warning triangle or exclamation mark: A fault or error has been detected. Check the error code displayed alongside it.
• Solid green light: System operating normally with no faults.
• Red or flashing amber light: A fault has been detected. Check the error code before taking any action.
Quick daily check: Glance at your inverter on any sunny morning. Green light on, sun icon showing, and a positive kW reading above zero means your system is running normally. If any of those three are missing during daylight hours, it is worth a closer look.
Noticed something unusual on your inverter display? Contact SolarThoughts® for a professional solar repair and maintenance check in Brisbane. Call 1300 846 844.
Error Codes: Which Ones Clear Themselves and Which Need Action
Under Australian Standard AS 4777.2:2020, all grid-connected inverters sold in Australia must automatically disconnect from the grid if voltage or frequency moves outside the permitted range. This means many apparent faults are actually the inverter doing exactly what the standard requires, disconnecting briefly while the grid stabilises.
Here is how to triage the most common fault categories:
| Fault Type | Typical Codes | What It Usually Means | What To Do |
| Grid overvoltage | 014, Error 302, Vac High, STATE 567 | Energex grid voltage above 253V | Usually self-resolves. If persistent daily, contact installer or Energex. |
| Grid frequency fault | F02, Hz Fault, Freq High/Low | Grid frequency outside 49 to 51Hz | Usually temporary. Self-resolves when grid stabilises. |
| Isolation fault | ISO Fault, F08, Error 38, Isolation Fail, E01 | Moisture or damaged insulation in DC wiring | Do NOT reset. Turn off both isolators and call a licensed electrician immediately. |
| Over-temperature | OT, Temp High, F04, Error 107 | Inverter running too hot | Check clearance around unit. Will restart when cooled. If recurring, call installer. |
| DC voltage high | Vdc High, F03, Error 105 | Panel voltage above inverter limit | Contact your installer. Usually a string configuration issue. |
| Communication error | Comm Error, WiFi Lost, Error 108 | Lost connection to monitoring platform | Check WiFi router. Safe to restart the inverter. |
The isolation fault rule is the most important safety point in this guide. An isolation fault (ISO Fault, F08, Isolation Fail, Error 38, or Error 109 depending on your brand) indicates that the insulation resistance in your DC wiring has dropped below the minimum level required by AS 4777.2:2020. This can indicate water ingress into DC cabling, a damaged isolator, or deteriorating cable insulation on the roof. Turn off the system at the AC isolator and DC isolator. Do not restart it. Contact a CEC-accredited solar installer in Brisbane before touching anything further.
Brand-Specific Display Tips: GoodWe, Sungrow, Fronius
SolarThoughts® installs GoodWe, Sungrow, and Fronius inverters across Brisbane, Gold Coast, and Ipswich. Each brand has its own display quirks worth understanding.
GoodWe: The LCD screen cycles through readings automatically. Press the front button to scroll manually. Key readings are labelled Ppv (panel power in), Pac (AC output power), and E-Day (daily energy). A completely blank screen almost always means the DC or AC isolator has been switched off, not a hardware failure. Connect the SEMS app for detailed monitoring and fault history.
Sungrow: Look for Pac for current power output and E-Day for daily energy. A solid green status light indicates normal operation. On newer models, a fault triggers both a code and a QR code on screen that you can scan with your phone for brand-specific guidance. Connect the iSolarCloud app for performance graphs, device alarms, and battery state of charge on hybrid systems.
Fronius: Use the physical navigation buttons to cycle through real-time data, daily logs, and error history. A STATE code followed by a number identifies specific faults. A STATE 522 at dawn simply means panel voltage is below the MPPT operating window before sunrise, which is completely normal and clears automatically once panels reach sufficient voltage. Connect Solar.web for weather-correlated performance analysis.
[IMAGE 3: Annotated photo of a GoodWe or Sungrow inverter display showing a healthy midday reading with labels on each figure. ALT: GoodWe solar inverter display reading Brisbane midday output kW]
Monitoring Apps vs the Physical Display
The physical screen tells you what is happening right now. The monitoring app tells you what has been happening over time, and whether that pattern is normal.
• SEMS (GoodWe): Real-time output, daily and monthly charts, fault history, and panel-level monitoring on systems with optimisers.
• iSolarCloud (Sungrow): Detailed graphs, device alarms, historical comparison, and for hybrid systems, battery state of charge and grid import data.
• Solar.web (Fronius): Professional-grade monitoring with weather-adjusted performance analysis and generation logs back to installation.
• SolarEdge monitoring platform (SolarEdge): Panel-level monitoring showing which individual panels are performing and which may be underperforming.
If your inverter is not yet connected to your home WiFi, setting it up typically takes 10 to 15 minutes using the instructions in your inverter’s manual. All four platforms are free to use. Connecting your system is one of the most effective ways to protect your solar investment without spending anything extra.
How to Reset Your Inverter (and When Not To)
Most temporary faults, including grid disturbances and communication errors, can be cleared with a full inverter restart. Here is the correct restart sequence:
1. Turn off the AC isolator on your switchboard (labelled Solar, PV Main Switch, or similar).
2. Turn off the DC isolator beneath the inverter on the wall, or on the roof for some installation configurations.
3. Wait a full 5 minutes to allow all internal capacitors to discharge completely.
4. Turn the DC isolator back on first.
5. Turn the AC isolator back on second.
6. Wait 1 to 2 minutes for the inverter to reconnect to the Energex grid and begin generating.
Never restart if your inverter is showing an isolation fault. An isolation fault under AS 4777.2:2020 indicates a potential wiring safety issue. Restarting without professional inspection is a fire and electrocution risk. Contact a licensed solar repair and maintenance team in Brisbane before doing anything.
Common Mistakes Brisbane Homeowners Make With Their Inverter Display
Confusing kW with kWh and concluding the system is broken : A 6.6kW system showing 2kW at 8am is behaving completely normally. The kW reading only reaches its daily peak around solar noon. The kWh daily total only makes sense when read at or after sunset.
Not checking the display during peak midday hours : This is when performance problems are most visible. A system showing 1.5kW at 12:30pm on a clear day is clearly underperforming. Checking only in the morning or evening gives you no useful benchmark.
Ignoring recurring error codes because the system appears to recover : A fault code that appears every morning and clears by 9am is worth noting and reporting. This pattern often indicates a developing fault that worsens progressively over time.
Attempting to reset after an isolation fault: This specific code requires a professional inspection before the system is restarted. It is the one case where a DIY restart is genuinely dangerous.
Assuming the WiFi icon not displaying means the system has failed: A missing WiFi icon only means the inverter has lost its connection to the monitoring platform. The system is almost certainly still generating power normally. Check your home router first.
Not comparing output year on year in the same season : A system generating 18kWh on a winter Brisbane day is not underperforming. The same system generating 18kWh on a clear December day almost certainly is. Seasonal context is essential.
Frequently Asked Questions
What should my solar inverter display show on a sunny day?
At peak midday on a clear Brisbane day, your inverter should show a kW reading of roughly 75 to 85% of your system’s rated capacity. A 6.6kW system should show between 4 and 5.5kW between 10am and 2pm.
What does kW mean on my inverter display?
kW is real-time power output. It shows how much electricity your panels are generating at that exact moment. This number changes constantly throughout the day.
What does kWh mean on my inverter display?
kWh is the total energy generated today since sunrise. It starts at zero each morning and builds throughout the day. This is the most useful number for tracking your daily solar performance.
Why does my inverter show zero output?
Zero output is normal at night and in very low light. During daylight hours, zero output usually means the AC or DC isolator is switched off, a fault code is active, or the inverter is mid-restart. Check your isolators first.
What is AC voltage and why does it matter in Brisbane?
AC voltage is the grid voltage at your property. Under AS 4777.2:2020, normal AC voltage must sit between 216V and 253V. Energex can occasionally push voltage above this range during high solar export periods, causing inverters to reduce output as a safety measure.
How do I know if my inverter error code is serious?
Isolation faults are always serious and require a licensed electrician before the system is restarted. Grid voltage and frequency faults are typically temporary and self-resolving. Refer to the fault table in this post for guidance.
How often should I check my inverter display?
A quick 10-second midday check two or three times per week is sufficient. Set up the monitoring app for automatic alerts without needing to physically check the display at all.
Can I reset my inverter myself?
Yes, for most fault types. Turn off the AC isolator first, then the DC isolator, wait 5 minutes, restart DC first, then AC. Never restart after an isolation fault.
What monitoring app works with my inverter?
GoodWe uses SEMS. Sungrow uses iSolarCloud. Fronius uses Solar.web. SolarEdge uses the SolarEdge monitoring platform. All are free to download and use.
When should I call a professional about my inverter?
Call a licensed solar inverter specialist in Brisbane if your system shows persistent isolation faults, consistently underperforms the midday benchmarks in this post, has a fault code that recurs daily, or has been offline for more than 24 hours.
Conclusion
Reading your solar inverter display is a skill that takes minutes to learn and pays off every time you check that screen. Understanding the difference between kW and kWh, knowing what healthy midday output looks like for your system size in Brisbane, and recognising which error codes need immediate action versus which ones self-resolve are the three things that put you in control of your solar investment.
Most problems visible on an inverter display are minor and temporary. The ones that are not tend to quietly cost weeks of lost generation before anyone notices. A quick midday check a few times per week, paired with a connected monitoring app, is all the protection most Brisbane systems need.
If your inverter is showing something you are not sure about, or your daily kWh figures look lower than the benchmarks in this post, contact the SolarThoughts® team for a professional solar maintenance check in Brisbane. You can also explore our solar inverter installation and replacement service if your inverter is ageing or showing repeated faults. Call 1300 846 844.
Sources
• Clean Energy Regulator, Solar Zone Maps (Australian Government)
• Australian Standard AS 4777.2:2020, Grid Connection of Energy Systems via Inverters (Standards Australia) — AC voltage limits, frequency protection, isolation fault requirements